
What does Brazil’s victory at the World Cup in Qatar have to do with finance

How does a World Cup win by Australia or Brazil connect with a loss of more than 70% in the S&P 500? The analysis by Anders Nysteen, Senior Quantitative Analyst for BG SAXO
The 2022 FIFA World Cup has come alive with bookmakers seeing Brazil as favorites to win the final. However, this is not the most interesting forecast for a quantitative analyst.
Why not look at the surprises that are already animating the first matches of the tournament? Can the outsiders aspire to the final victory or is it completely unlikely?
In order to quantify the surprising scenarios for the World Cup, it is necessary to estimate the probabilities for the different outcomes of a match, given some metrics related to each individual team. For this exercise we rank the various national teams according to their Elo rating, a value that emerges by comparing the skill level of teams/players in a given field (in this case football). This metric has proven effective for predicting the outcome of a match, with a higher probability of winning linked to a high Elo rating.
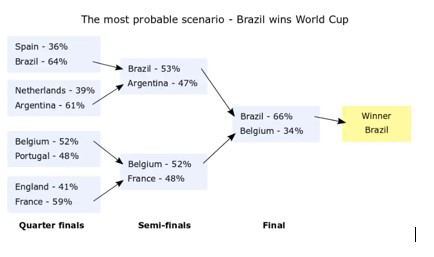
A standard example for World Cup winner predictions is to assume that the team with the highest probability will also be the winner which, in line with bookmakers, predict Brazil as the winner:
Bootstrapping to find less likely scenarios
We now leave the most likely scenario and artificially simulate that the World Cup is played 10,000 times, using these odds of winning to determine the outcome of each individual game. The method is well known in both the sciences and the financial sector and the result is 10,000 different equally probable outcomes for the World Cup. Some of these scenarios see domestic outsiders as winners, such as this example starting in the round of 16 with Australia winning:
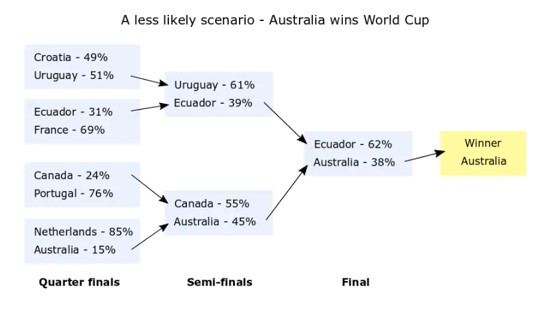
Only 2 of the 10,000 scenarios position Australia as the winner and, as shown above, Australia will need some more or less sensational events to beat the Netherlands (estimated 15% chance of winning).
Combining all 10,000 scenarios, the estimated probability for each country of winning the World Cup is as follows:
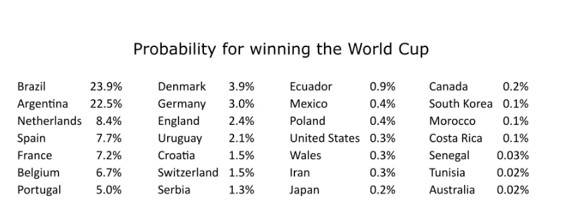
An overview like this reveals that preferred scenarios with Brazil as winners are likely only 1/4 of the time and that other lower tier teams like Denmark and Uruguay have decent chances of winning.
Queue scenarios in risk management
How is this path identical to investment risk management? Let's say you invested in the S&P 500 index five years ago. Assuming dividends are reinvested, the return would be 66% on the investment, which sounds like a brilliant return. But returns cannot be mentioned without considering the risk associated with the investment. And performance is based on an accomplished journey, but what if the macro events were different over the past five years? Would the investment have been as good?
One way to quantify risk is to apply bootstrapping to estimate all scenarios, not just the most likely one. Since five years ago, the return of the S&P 500 index has been in most weeks around 0.5%, and the return in half of the weeks has been between -1.1% and 1.7%.
There are however some weeks that rarely occur with very important losses or gains, exactly like the scenarios where Australia wins the World Cup. In the worst week, the S&P 500 index lost nearly 15% of its value. Therefore, when making investment considerations, these so-called tail scenarios can have quite a large impact on performance and therefore cannot be ignored, despite the small odds.
A standard way to quantify the impact of these low probability events is therefore through the bootstrapping method. We do this by simulating 5 years of performance for 10,000 different scenarios. For each scenario we create an artificial 5-year performance path by drawing the weekly return from the histogram above. Therefore, some of the scenarios will contain many positive weeks, others very negative events. The latter are exactly what is important to investors considering their risk profile. Below we show the 10,000 simulated scenarios that could occur with equal probability, including the actual cumulative performance indicated by the black line.
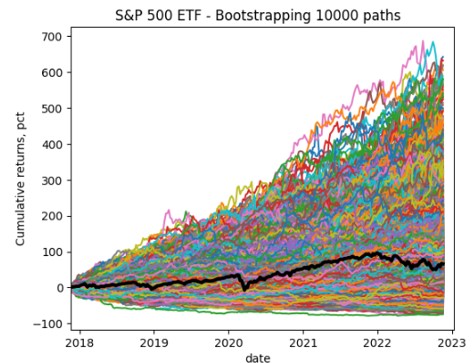
If we compare events which (according to this basic model) are as likely to occur as the probability of Australia winning the World Cup, ie 2 in 10,000, the lucky investor would have gained 632%. And the hapless investor would have lost over 72% of the value invested in the worst 2 out of 10,000 scenarios.
In regards to both the World Cup and financial investment, the least likely events are usually the most exciting, and bootstrapping is an easy way to quantify those probabilities. When it comes to asset management, tail events can have a major impact on performance. There are several ways to minimize the impact of these tail events, such as having diversified portfolios where different assets have low correlations. Or considering Options which are very out of the money and will only be triggered in these tail events, although there is a premium associated with buying the Option.
Note that the purpose of the bootstrapping exercise above is not to get the correct mathematical inaccuracies, but should serve as an illustration of how bootstrapping works when quantifying low-probability events. All simulated returns are based on historical data and should not be relied upon as an indication of future returns. Odds used and Elo ratings were current as of November 18, 2022.
This is a machine translation from Italian language of a post published on Start Magazine at the URL https://www.startmag.it/economia/brasile-mondiali-qatar-vittoria/ on Sun, 27 Nov 2022 06:29:12 +0000.