
The historical series of productivity: ISTAT and AMECO data

How many times have we heard on TV that Italy's problem is productivity ? Many times, by the politician or the mainstream economist on duty.
A very superficial narrative as if, all of a sudden, a wave of prigration had hit the country and the Italians, suddenly, turned from ants to cicadas.
Joking aside, how are things really? Let's look at some productivity measures from the last 40-50-60 years to understand what happened.
PRODUCTIVITY OF WORK
With "labor productivity" we mean the relationship between added value and hours worked (see ISTAT definition ).
To build the series, we take the data from AMECO – the database of the European commission – starting from the first year available to extract the data, that is 1970.
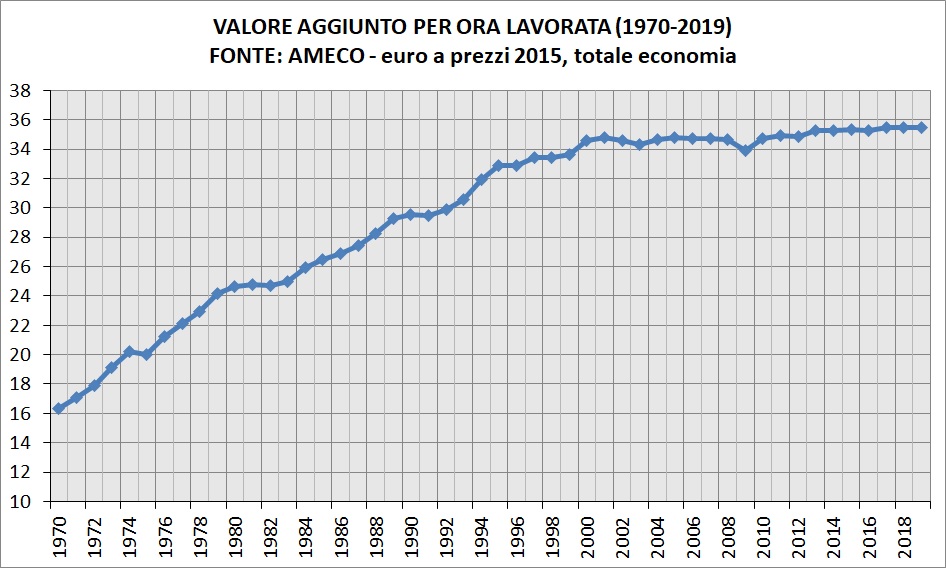
As you can see in thirty years of "liretta" productivity has more than doubled, from € 16.3 in 1970 to € 34.8 in 2001. The variation is the real one, since the data are expressed at the prices of 2015 .
From the introduction of the euro to today, productivity has grown very little, from € 34.6 in 2002 to € 35.5 in 2019. The entire historical series covers all economic activities.
To check the very simple calculation, here are the codes to be entered on AMECO: for the “added value at 2015 prices” enter “ OVGE “, while for the “total hours worked” enter “ NLHT “.
Now let's look at the graph of the added value per employee, the ameco code for having the total number of employees is “ NETD “.
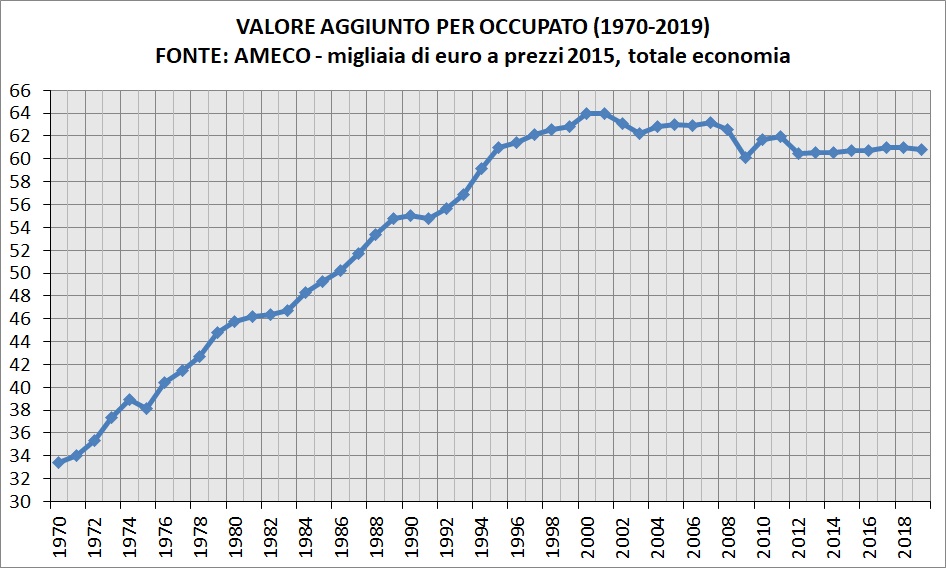
In this case, no progress has been made within the euro, in 2019 the value added per employee remained at the levels of 1996 in real terms, i.e. around € 61,000 at 2015 prices.
Going back to talking about the added value for the hour worked , we conclude the topic with a graph published by ISTAT in 2010, a little old but still interesting.
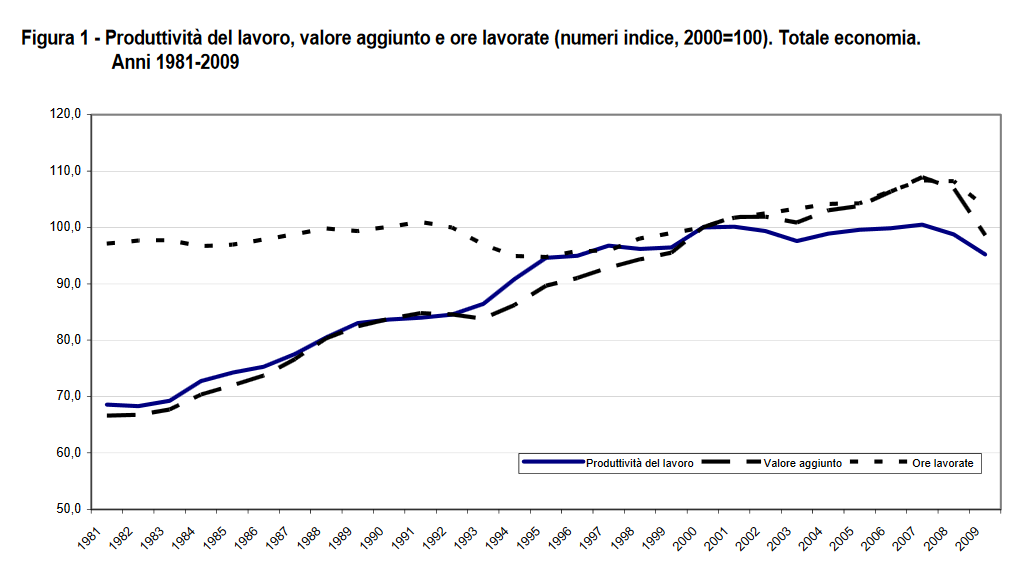
In this case the “ index number ” is used with 2000 taken as the reference year . In the first year available – that is 1981 – the index was just under " 70 " points while in 2000 it was " 100 ".
Even with this graph it is clear that, before the single currency, Italy did not have particular productivity problems, except when we had blocked the exchange rate of the lira , with the entry into the narrow band at the beginning of 1990 and the return to the EMS. at the end of 1996.
Another indicator is worth analyzing, as it is a lot of talk.
TOTAL FACTOR PRODUCTIVITY
In contrast to the data just analyzed, there is a thesis according to which the Italian decline began long before the euro, the proof is in an indicator called “ total factor productivity ” (in Italian “ total factor productivity ”).
Here is one of the many discussions on Twitter, where the very peaceful Boldrin drops his ace up his sleeve.
Tell me, what figures do I invent? Tell me. Productivity'? Here it is https://t.co/OVapPZOB0l
Cowardly liar.The second sentence is meaningless, anonymous fool. Like all anonymous cowards with dirty flags minds. At least Mori put his face on it, you're just a coward.
– Michele Boldrin (@micheleboldrin) May 6, 2020
What should the TFP measure? In theory, progress can be traced to technological progress. According to Boldrin, Italy has not invested in new technologies for at least 40 years and this fact would be the source of the current troubles.
The defense argument, up to now, has mainly been to point the finger at the low reliability of the indicator, pointing out that it is a simple "gap" for measurement errors.
Tell that charlatan who posted the graph of total factor productivity, a residual index that sums up the estimation errors of all the others and has rightly been called "the measure of our ignorance".
– Gilberto Trombetta (@ Gitro77) December 10, 2019
Obviously, this objection was certainly not accepted and that graph is promptly re-proposed. Is TFP really the "smoking gun" that questions the data we've seen before?
We take the reliability of the indicator as good, that is, that TFP actually measures the benefits of technological progress.
Before any consideration of the data, what is the source of the graph of discord?
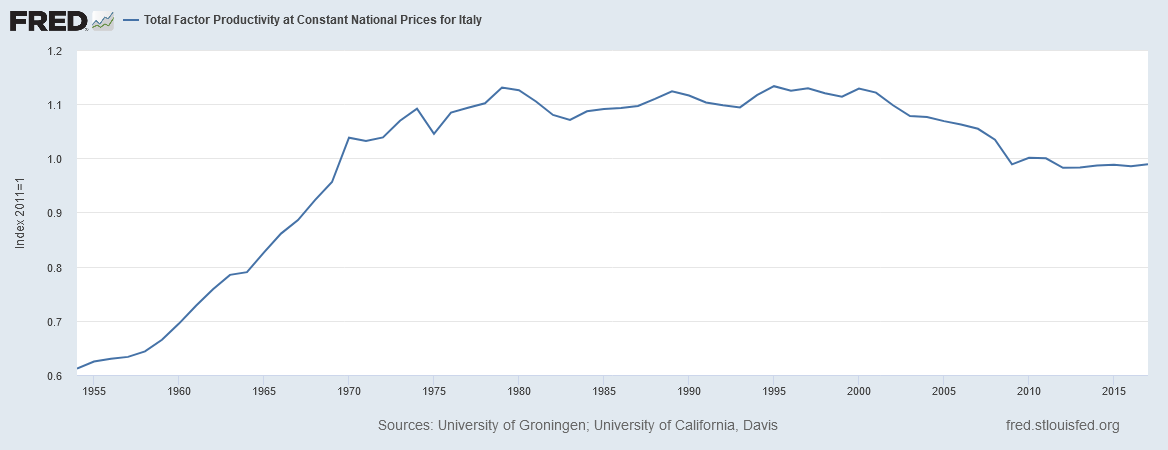
It says at the bottom " University of Groningen ": the first observation is that it is NOT an official source (as AMECO and ISTAT are) and therefore it CANNOT be taken at face value.
To assess its reliability, it is sufficient to simply compare the TFP of the Dutch university with that calculated by the various official sources , to see if the data correspond.
Returning to the AMECO database , among the numerous indicators available there is the total factor productiviy (code ZVGDF ), here is the series from 1960 to 2019.
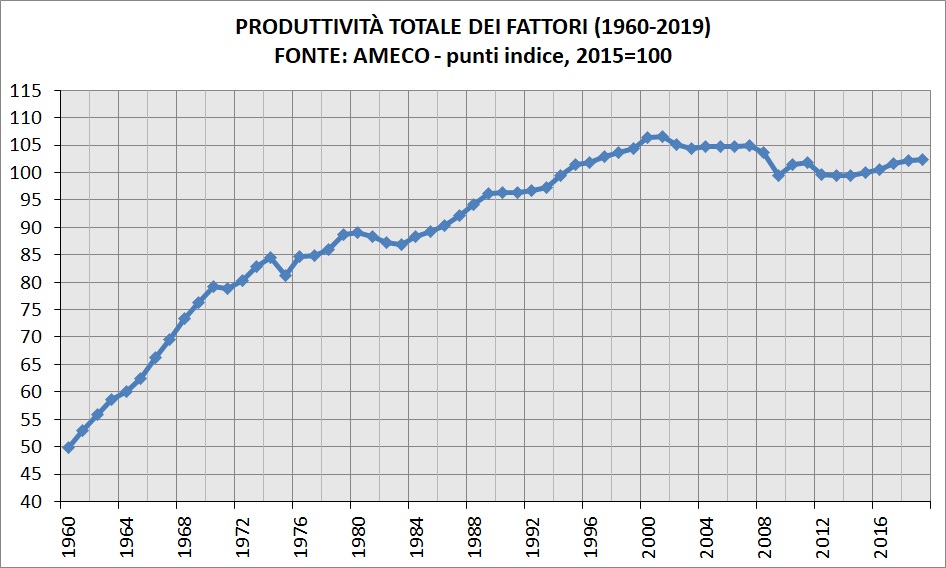
As you can see, it is completely different from that of the University of Groningen : that of AMECO shows ups and downs but overall the total factor productivity ( PTF ) has gone from “ 89 ” points in 1980 to “ 106.5 ” in 2001.
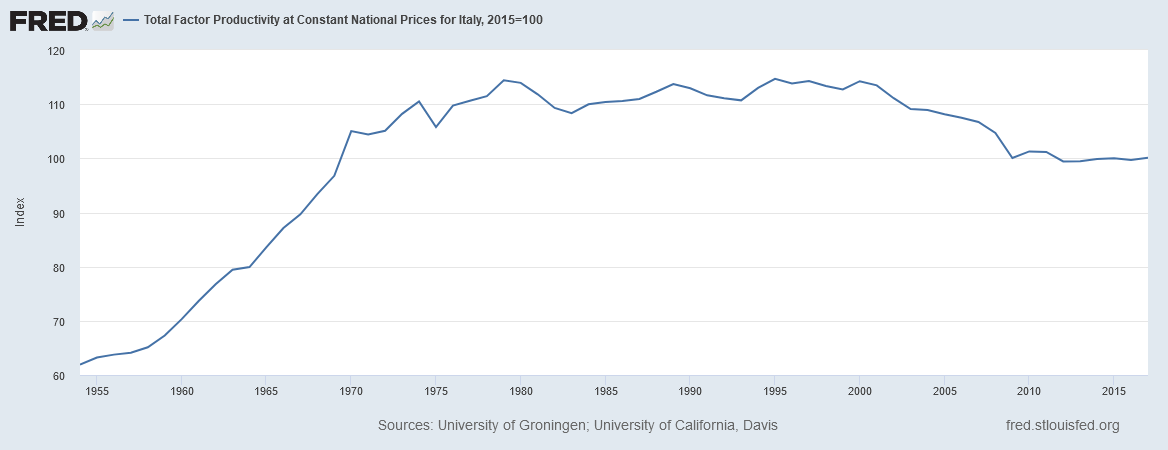
Instead the Dutch one remains practically “flat” (below the graph with the reference year moved to 2015), in 1980 it was 113.9 points while in 2001 it was 113.5.
Now let's see that of the ISTAT , again from that 2010 document that shows the trend of total factor productivity from 1981 to 2009.
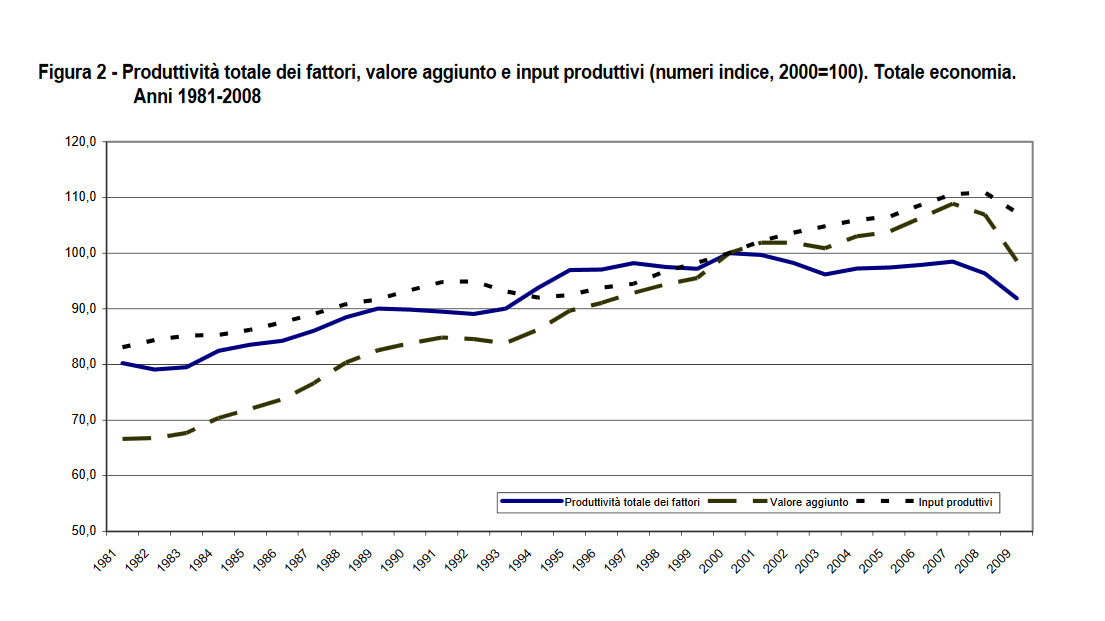
In 1981, total factor productivity was “ 80 ” points while in 2000 it was “ 100 ” (which coincides with the reference year for this series), not even here no stagnation in the twenty years before the euro.
Below the Dutch graph with the reference year moved to 2000, where the TFP – in the same time frame – oscillates between 95 and 100.
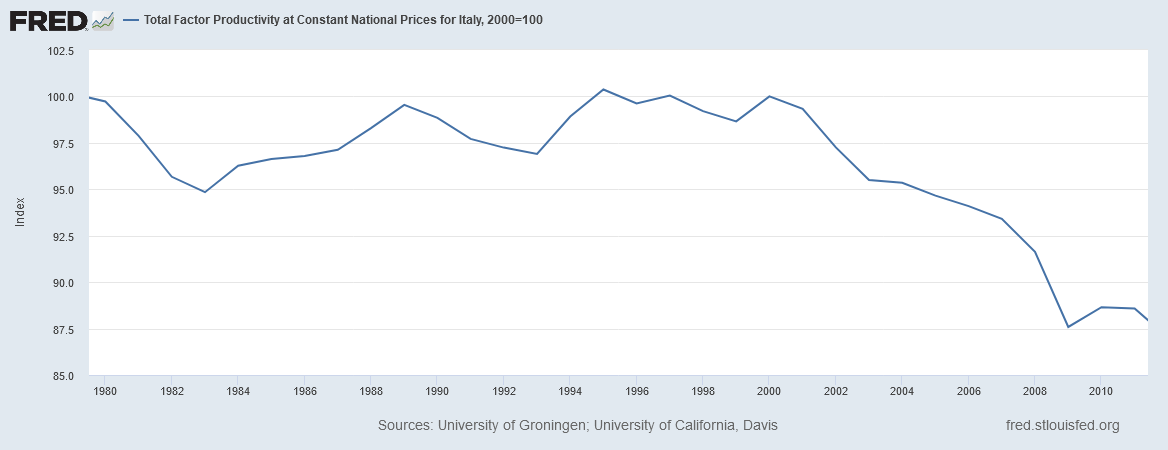
As you can see, even changing the reference year the trend of the indicator always remains the same. The point is that the Dutch data is completely misleading with respect to ISTAT and AMECO , ergo it certainly cannot be considered valid.
At the end of the fair it is not enough to “look at the data”, it is also necessary to verify the reliability of the source . And all this regardless of whether the TFP is considered “the measure of our ignorance” or the best existing macroeconomic indicator.
The fact is that, with the correct data , even the TFP is yet another indicator that goes "to be blessed" in the second half of the 90s and then definitively succumbs with the euro.
PAST, PRESENT AND FUTURE OF PRODUCTIVITY
In its latest annual report, the Bank of Italy devoted a paragraph to various forms of productivity. Let's take the 2019 report , where the following table is found on page 60.
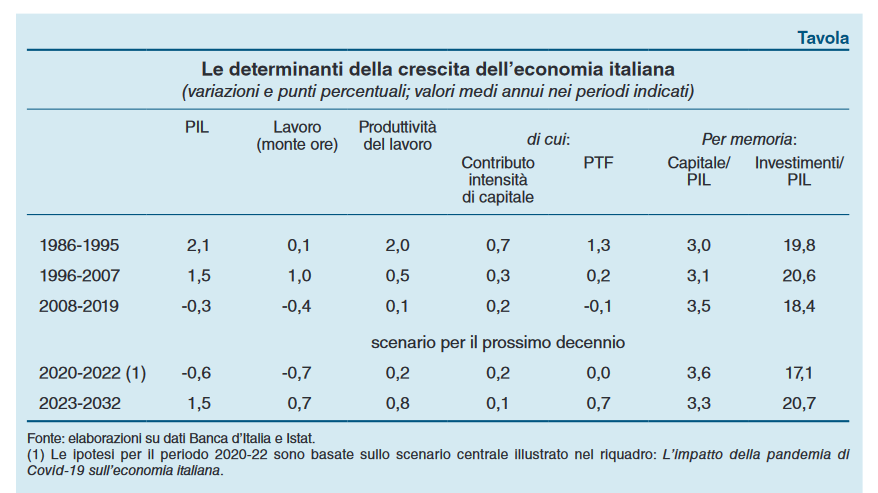
As you can see, from 1986 to 1995 the average annual growth of GDP was 2.1%, labor productivity growth of 2.0% and that of the TFP by 1.3%.
The source of the data is obviously the ISTAT, in case someone still had doubts about who does the accounts in this country. As for the projections up to 2032 , on page 61 there is the comment of the table.
" Assuming that the hours per employee return to the levels of 2019 and that the unemployment rate gradually falls to values of just under 9 per cent, in the decade 2023-2032 the total number of hours worked would make an appreciable contribution to the growth of Italian GDP , in the 'order of 0.7 percentage points on average per year (table).
In this context, in order to bring the average rate of GDP growth back to 1.5 per cent in the decade under consideration in the ten years preceding the global financial crisis, labor productivity should increase by around 0.8 per cent per year. between 2023 and 2032. This result would be achievable with an average annual increase in total factor productivity (TFP) of approximately 0.7 per cent, combined with a recovery in accumulation which, by increasing capital intensity, would bring ratio between investments and GDP at the levels of the decade 1996-2007 (around 21 per cent on average for the period).
The projected increase in TFP is placed in an intermediate position between the very positive dynamics observed on average in the years 1986-1995 and that, much more modest, of the following ten years (table). (…) "
Finally, in the governor's conclusions, also in the same publication, there is also a graph that illustrates GDP and labor productivity projected up to 2035.
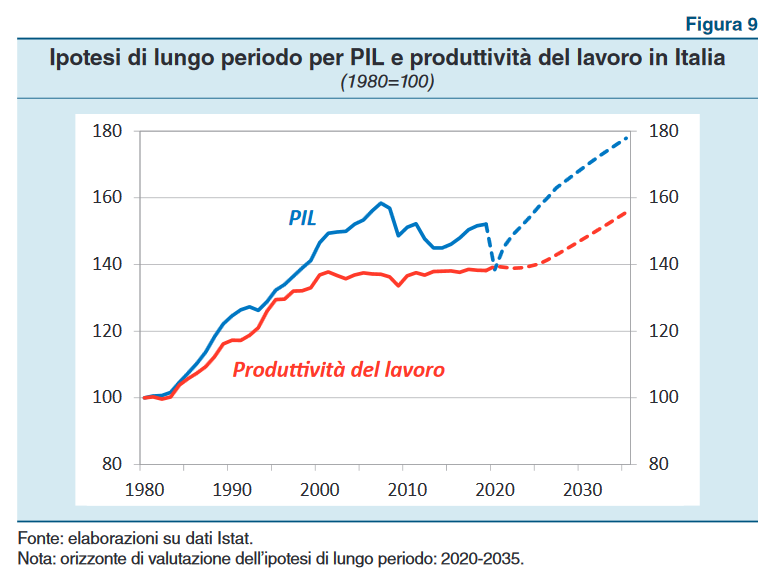
Now there should not be any doubt since productivity has become a problem in Italy, or rather the consenguenza a "probl € but."
![]()
Thanks to our Telegram channel you can stay updated on the publication of new articles of Economic Scenarios.
The article The historical series of productivity: ISTAT and AMECO data comes from ScenariEconomici.it .
This is a machine translation of a post published on Scenari Economici at the URL https://scenarieconomici.it/la-serie-storica-della-produttivita-i-dati-istat-e-ameco/ on Wed, 13 Jan 2021 10:02:37 +0000.