
Dragon or Eagle? The future of Italian exports between the US and China. Sace report

How and how much Italian exports to the US and China will change. What emerges from the recent report by the Sace research office
The recovery of Italian exports passes through trade exchanges with the two richest economies on the planet: the United States and China.
USA – Italy: a long history of trade
The United States is one of our major commercial partners, with an incidence on Italian exports of almost 10% in 2020 , gradually rising after 2009, annus horribilis of the Global Financial Crisis (CFG). Exports of Italian goods to Washington went from 26 billion euros in 2001 to 42.5 billion. Since 2009, the growth of our exports to the USA has been accentuated and well above that of total Made in Italy (in order, + 6.4% and + 1.4% between 2011 and 2020).
Italy in the USA: not just wine and fashion
The trade of Italian goods in the United States is varied. According to the data reported in the Sace report, instrumental mechanics accounts for over a fifth of the total, followed by chemistry, means of transport, food and beverages. "In the last twenty years, growth has been particularly marked for chemicals, which went from 1.9 billion euros in 2001 to 7.5 billion in 2020 thanks to the driving force of pharmaceuticals, but also for means of transport, where to grow at The automotive and shipbuilding industries were at a sustained pace – reads the Report -. The US market also constitutes a large part of the demand for Made in Italy food and beverages – especially wine and pasta – having received over 13% of the sector's Italian exports in 2020. While still remaining an important destination for the fashion and of other consumption, the weight of the same on Italian exports to the country has decreased over the years ".
Expectations for export growth to the USA: + 11%
The trade dialogue with Washington will become even more flourishing. According to Sace estimates, after the 6.7% contraction in 2020, exports will resume growth with + 11% this year and + 4.7% in the following three years, exceeding 54 billion euros in 2024. The excellent prospects of recovery in the US are linked to the huge aid and relaunch packages envisaged first by the Trump administration and now by the Biden administration. The Build Back Better Agenda aims to create jobs and cut taxes, all in order to increase liquidity in the hands of American families.
The increase in demand for intermediate goods
In addition, the Infrastructure Investment and Jobs Act is a $ 715 billion investment plan that will last 8 years. The program allocates federal aid for infrastructure such as highways, motor vehicles, research and development, rail programs, broadband, power grid renewal but also social support programs. According to Sace analysts, this plan will lead to an increase in demand for some imported goods. "Precisely in this perspective, a substantial recovery is expected already this year and a sustained dynamic in the following three years for the Italian export of intermediate and investment goods (respectively + 10.4% and + 10.6% in 2021, +6 , 7% and + 3.6% per year, on average, between 2022 and 2024) – reads the report -. The recovery for consumer goods is slower, as they will only be able to overcome the pre-pandemic level in 2022 ”. It will go even better for the agri-food sector which, after the + 5.4% recorded despite the crisis, should expand to 9.4% this year ”.
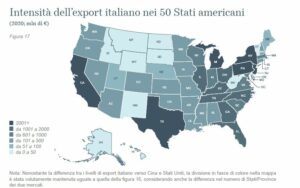
Atlas of made in Italy in the USA
The US territory is vast and heterogeneous and includes very different states in terms of population, wealth, propensity to buy, type of industry and need for imported goods. The states on the east coast and in the Midwest receive most of our exports and among the major importers of Made in Italy products are the richest and most populous states such as: New Jersey (about 6.1 billion euros of Italian exports in the 2020), New York (4.4 billion), California (3.2 billion) and Texas (2.9 billion). As for food, the largest importers are California (about 0.8 billion euros in 2020), New Jersey (1.2 billion) and the State of New York (0.7 billion), which have a large Italian American community. In these states the jewelery, art objects and leather goods, ceramic and stone items, textiles and clothing sectors are also doing very well (New York and New Jersey import over two thirds of Italian textiles and clothing to the country) . For intermediate goods, especially pharmaceuticals , exports of Italian products are directed to Pennsylvania, Tennessee and New Jersey . The demand for investment goods is, on the other hand, particularly high in Michigan (around 2.5 billion euros in 2020), one of the states where the automotive industry is strongest, also considering the corporate ties within the Stellantis group, but also in Texas (1.6 billion), where we mainly export valves and turbines for the Oil & Gas sector.
2001-2021: twenty years of Italian exports to China
Since 2001, the year in which China joined the World Trade Organization, Italian exports have grown in tandem with the growth of its economy, passing over this timeframe from 3.3 to 12.9 billion euros and growing to an annual rate of 7.1%.
The main sectors of Made in Italy export: mechanics, chemicals and investment goods
The main Italian export sector is instrumental mechanics but chemistry, textiles and clothing, metals and means of transport are also doing very well. Over the next few years, Sace analysts expect our exports to grow by 10% this year and 3.4% in the following three years. “This dynamic will allow Italian sales in the Country of the Dragon to reach 15.6 billion euros at the end of the forecast horizon – reads the report -. The expected trend for investment goods is particularly positive, spread to all sectors, especially for mechanical engineering (+ 11.3%, for a value that should exceed 4.7 billion) and for electrical appliances (+7 , 7%), the latter category also grown in the previous 12 months ".
The spending plans of the Chinese government
The export of investment goods is favored by the spending plans put in place by the Chinese government in order to support the economic recovery and push the Chinese economy towards a more innovative and high-tech system (development of 5G, Artificial Intelligence, modern transport infrastructure, electric and high-speed vehicles.
The many Chinese economies
The Chinese economy is not a monolith but a set of several realities that enjoy different levels of development. The provinces on the east coast (Bejing, Fujian, Guangdong, Hainan, Hebei, Jiangsu, Shandong, Shanghai, Tianjin and Zhejiang) represent the engine of Chinese growth, accounting for over 50% of GDP although they host about a third of the national population. In the last 10 years, the Chinese inland provinces have shown more sustained growth rates in terms of income and productivity than the coastal area. Furthermore, the development of internal economies has been driven by the search for lower production costs by the manufacturing industry and by the growing importance of raw materials, which abound in the central provinces.
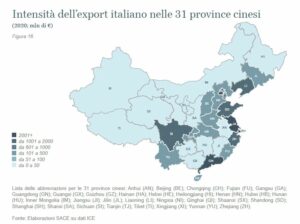
Italian exports between the Chinese provinces
The differences between the levels of development are reflected in the territorial distribution of Italian exports among the 31 different Chinese provinces in 2020. "Nine of the ten provinces of the east coast are among the main destinations of Italian sales within the Chinese borders – reads in the report -. Furthermore, the top five destinations, in order of exported values, Shanghai, Guangdong , Beijing, Jiangsu and Zhejiang, represent over 80% of our exports to China, with Shanghai alone worth 41%. Guangdong province is the recipient of Made in Italy goods for over 1.5 billion euros in 2020, in Jiangsu , we exported over 1.2 billion euros, the provinces of Zhejiang (811 million euros of goods sold in 2020 ) and Shandong (€ 379 million) offer multiple sectoral outlets, thanks to the presence of numerous industrial clusters (metals, electronics and packaging).
Shanghai and Beijing: luxury made in Italy destinations
In the provinces of Shanghai and Beijing they are the financial and political capitals of the country. The per capita income recorded in these two provinces is much more than the Chinese average (over 72,000 yuan in Shanghai and 69,000 in Beijing at the end of 2020, above $ 37,000 in purchasing power parity). This makes Beijing and Shanghai two particularly attractive destinations for the export of final consumer goods , such as those related to luxury or fashion, of which Italy is among the main world leaders. This is all the more true given the "change of course of the economic objectives of the Chinese Communist Party, which intends to support an increasingly sustainable growth and which favors the development of domestic demand, as also underlined on the occasion of the 14th Five-Year Plan (2021-2025 ) ".
This is a machine translation from Italian language of a post published on Start Magazine at the URL https://www.startmag.it/economia/dragone-o-aquila-il-futuro-dellexport-italiano-tra-usa-e-cina-report-sace/ on Sun, 26 Sep 2021 04:03:16 +0000.