
US real estate prices: are we really at the highest?
In general, the US national price index S&P Corelogic case Shiller seems to show a healthy market, with growth present, even if slowing down compared to the best moments, as you can see from the following graph:
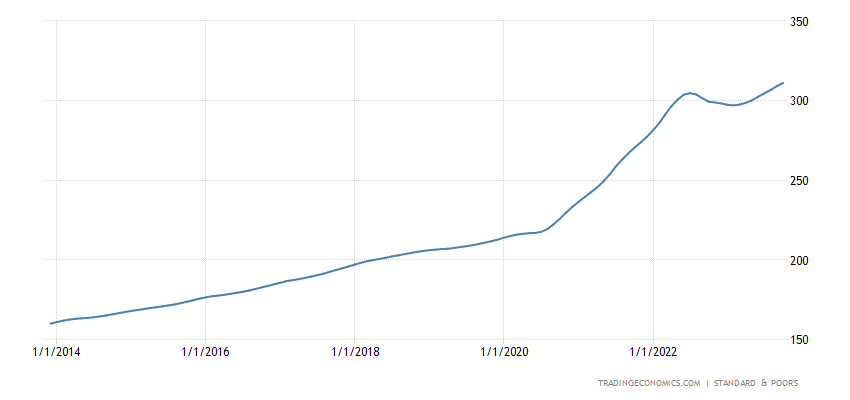
But don't be fooled, because this graph is national, while the situation is deteriorating where prices are highest, the large urban centers. Home prices in the 20 metro areas now covered by the S&P CoreLogic Case-Shiller Home Price Index posted the smallest monthly increase (+0.2%) since January, and remained slightly below the all-time peak of June last year. . Here's the close-up. In a moment we will enter the most splendid of the 20 subways in all their individual glory.
The S&P CoreLogic Case-Shiller Home Price Index uses the “sales pairs method,” comparing the sales price of the same home over time, thus eliminating the problems associated with average price indices, this imposes a lag in the data: today's index for “September” is a three-month moving average of home prices for which sales were recorded in public records in July, August and September.
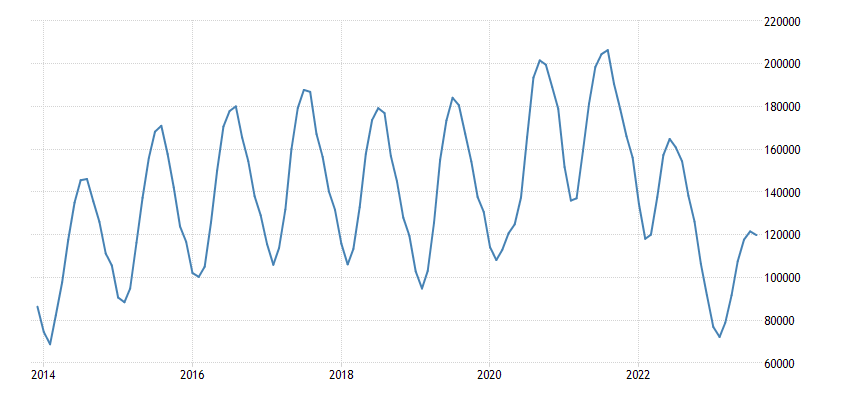
In contrast, the national average price index compiled by the National Association of Realtors reported by Wolfstreet , fell for the fourth consecutive month in October and was down 5.1% from the all-time high in June 2022, making 2023 the first year since the real estate crash that the current year's seasonal high was lower than the previous year's high. And this is a real national index. Furthermore, if we look at the data, these data show how the increase in sales is in rather secondary counties, confirming that the problem is in large cities.
The “National” Case-Shiller Index has reached an all-time high much to the delight of the media, but the Case-Shiller Index, the most reliable around, does not cover the entire United States; it only covers the 20 metros discussed here, and that has dropped. Among other things, we are talking about the properties with the highest valuation.
Then there is another survey problem: S&P CoreLogic, in its attempt to give the data of the 20 cities the aura of a "national" index, combined the clean Case-Shiller data of the 20 cities with the data of the FHFA house price index. The FHFA data is based on mortgage data from Fannie Mae and Freddie Mac , but thus systematically excluding all cash transactions and all transactions with mortgages that were not purchased by Fannie and Freddie. therefore the national price index reports spurious values, again according to Wolfstreet.
So the real Case-Shiller numbers of the 20 cities updated to today.
Prices are below 2022 peaks in 9 of the 20 index metros (% from respective peak):
San Francisco Bay Area: -11.2%
Seattle: -10.4%
Las Vegas: -5.6%
Phoenix: -5.6%
Portland: -5.0%
Denver: -4.7%
Dallas: -4.1%
San Diego: -2.0%
Los Angeles: -1.1%
Prices Set New Highs in 10 of the Index's 20 Metros (% YoY):
New York: +6.3%
Detroit: +6.7%
Chicago: +6.0%
Boston: +5.3%
Cleveland: +5.0%
Miami: +5.0%
Carlotta: +4.7%
Washington DC: +4.4%
Atlanta: +4.3%
Tampa: +1.5%
So the image is not positive everywhere, in fact it is very varied, and, on average, the price is falling in the major cities. The national price, in addition to mixing very different areas, excludes cash transactions, and therefore those made, often , at lower prices, let's say clearance, take it or leave it offers.
![]()
Thanks to our Telegram channel you can stay updated on the publication of new Economic Scenarios articles.
The article US real estate prices: are we really at the highest? comes from Economic Scenarios .
This is a machine translation of a post published on Scenari Economici at the URL https://scenarieconomici.it/prezzi-immobiliari-usa-veramente-siamo-ai-massimi/ on Wed, 29 Nov 2023 08:00:05 +0000.