
All the hidden costs of inflation for Italians. Money farm report
Moneyfarm survey: up to 4,000 euros in extra costs a year for many Italians due to inflation. Facts, numbers, forecasts and comments
In December 2022, prices in Italy grew by 11.6% compared to December of the previous year, a value not seen since the first half of the 1980s. The reality, however, is that for many savers, inflation has risen to 18.3% and costs, in absolute terms, up to 363 euros more per month: 4,000 euros more in a year.
ACTUAL INFLATION
This is what is calculated by Moneyfarm, an asset management company with a digital approach, which used the "effective inflation" indicator to address the most urgent issue today for the personal finances of Italian families. Starting from the latest ISTAT data on inflation in 2022 and crossing them with the 2021 photograph of the consumption of 52 different household and consumer profiles, Moneyfarm estimated with the support of Smileconomy, an independent company specializing in financial education, the actual inflation: a indicator that measures the different impacts of inflation on savers' pockets, depending on their lifestyle and consumption mix.
INFLATION LIKE TEMPERATURES: IT CHANGES WITH THE INDIVIDUAL
In December 2022, inflation measured by ISTAT marks +11.6% compared to December 2021, but for the 52 profiles traced, actual inflation ranges from 11.5% to 18.3%, since the actual consumption of the families examined they “beat” the average inflation of the ISTAT basket. Reasoning in absolute terms, Moneyfarm's calculations show that inflation costs households from 188 to 363 euros more per month, which, on an annual basis, means between 2,000 and 4,000 euros more.
In light of this, in order to continue to maintain their lifestyle and neutralize the effects of exceptionally high inflation, an Italian family should save between 10% and 15% of its income ("antidote savings rate"). . Therefore, families who, before 2022, saved less had to give up some consumption or draw on their savings to keep their consumption unchanged. Currently, however, Italians save an average of 7% of their income, so they would not be able to face a new wave of inflation in 2023.
In the table below, which shows the inflation of each of the 12 components of the ISTAT basket during 2022, significantly different trends in the prices of the individual categories of goods and services catch the eye: ranging from the stratospheric 54.5% increase in the item Housing, water, electricity and fuel to the decrease of 1.3% of the item Communications.
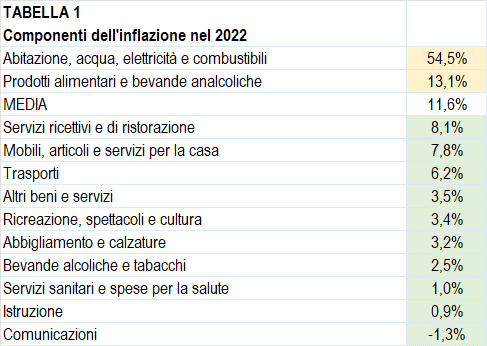
Effective inflation is a useful indicator to show what lies behind the average inflation figure because, in reality, every family has its own consumption habits, lifestyle and therefore its own inflation. Based on the price trends shown below, it can easily be understood that households that concentrate most of their expenditure on the most essential goods and services such as energy and food products inevitably suffer higher inflation than households who can afford to further diversify their spending habits.
Among the 52 types of consumers analysed, the unemployed have the highest effective inflation, at 18.3%. When those who should bring the money home are unemployed, inflation acts as a hidden tax of 241 euros per month on an average monthly expenditure which at the end of 2021 was 1,319 euros per month. A tax which, in the absence of aid and bonuses, probably means having to further cut consumption for the family.
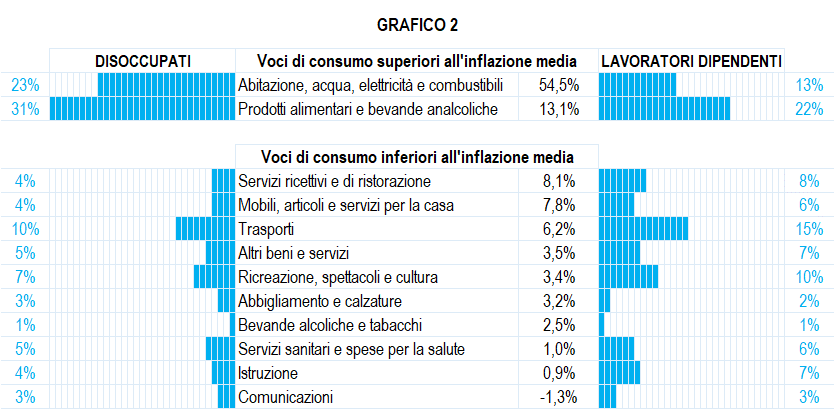
When the spouse is an employee, on the other hand, the effective inflation is 13.1% and the additional monthly expenditure amounts to 308 euros. Graph 2 clearly explains why the unemployed and employees are at the extremes of the perceived inflation index.
The unemployed use 54% (sum of 23% and 31% at the top left of the graph) of their savings for expenditure items characterized by higher than average inflation. On the other hand, households with one employee spend only 35% on those same items (sum of 13% and 22% at the top right of the graph). Those who are unemployed spend proportionally much more on essential goods such as energy and food: the two items with the highest inflation. Those who, on the other hand, can count on stable incomes such as employees, spend in a more balanced way, on more items of consumption, and are therefore less affected by inflation.
If we look at households, it is singles who have the worst, with effective inflation of 16.8% and an additional monthly expense of 208 euros, but for the elderly alone the situation is unfortunately even worse: 17.6% actual inflation and 188€ the additional monthly expense. At the other extreme are couples with two children, with effective inflation of 13%.
THE CRAZY PRICES OF LIGURIA
In addition to occupational categories and households, the territorial dimension in which families live were also examined, from which it emerged that effective inflation is higher in metropolitan areas, where it reaches 16.2% and involves additional 309 euros per month. While the families living in small municipalities (under 50,000 inhabitants), have an effective inflation of 13.9%. At the regional level, Liguria (13.9%) is at the top of the ranking of regions with the highest effective inflation, with a monthly increase in expenditure of 277 euros. At the bottom of the ranking we find the Autonomous Province of Trento, where the figure is more than two percentage points lower (11.5%).
This is a machine translation from Italian language of a post published on Start Magazine at the URL https://www.startmag.it/economia/ecco-i-costi-occulti-dellinflazione-per-gli-italiani/ on Sun, 12 Feb 2023 06:47:43 +0000.