
I’ll explain the causes and effects of the great demand shock
Supply chain: the big demand shock is now, here's why. The analysis by Richard Flax, Chief Investment Officer Moneyfarm
In the past month, the earnings season has kicked off in both the US and Europe, with 80% of S&P 500 companies reporting earnings growth that is not only positive but higher than expected. The publication of the economic results of the third quarter was highly anticipated to verify the health of listed companies, in a particular economic phase like the one we are seeing.
In fact, the main equity indices continued their run-up in October, despite the fact that there are signs of a macroeconomic landscape that is somehow more mature and characterized by certain risks: galloping inflation, rising energy prices and problems with supply chains. .
The role of demand in supply chain problems
Global supply chains are known to have come under unprecedented pressure over the past eighteen months. The phenomenon is very varied and takes different forms, from the closure of plants in Asia, to the increase in demand for gym equipment in the United States and the United Kingdom, to the lack of labor in the agricultural sector, just to name a few.
Going to retail sales in the United States can offer insights into the nature of the phenomenon. The chart below shows total retail sales in the United States over the past three decades. At first glance, it is clear how consistent the trend is. Until the end of 2019, there was a steady growth in the consumption of goods, marked only by a brief decline in 2009.
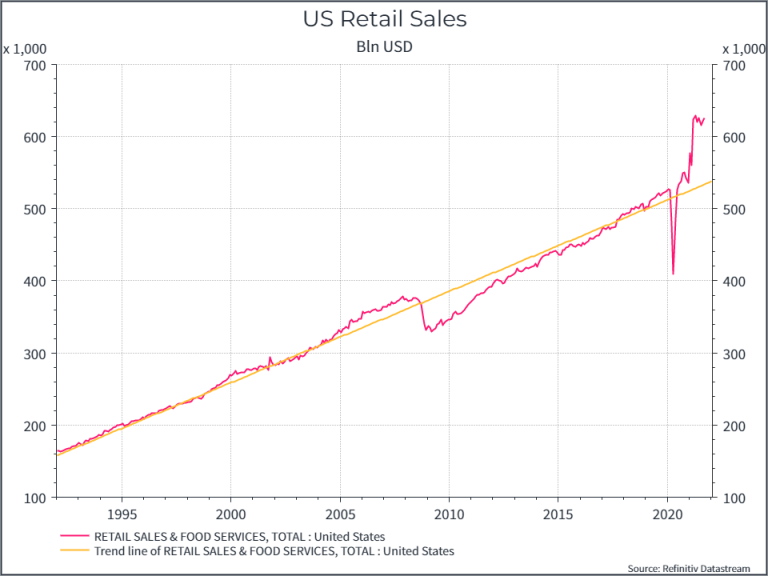
But Covid has brought a significant shock, first in terms of a slump in demand and then, surprisingly quickly, to a higher level of retail sales – a step change that, so far, has not really normalized towards the trend. long-term.
There was certainly a demand shock in March-April 2020, but probably the real demand shock, at least in terms of higher retail sales, is what we are currently experiencing in the US. The positive surprise in demand is driven by income support (in some cases income increases) and by the fact that people have switched from consuming services (restaurants, travel) to consuming goods. Inevitably this is only part of the story – we have also seen significant production stoppages for a variety of reasons mostly related to the pandemic, but the retail sales chart shows how important this trend was and how much sales are still above. of the medium-term trend. In a global supply chain optimized to operate at maximum efficiency while reducing waste, this fact alone could have been enough to cause disruption.
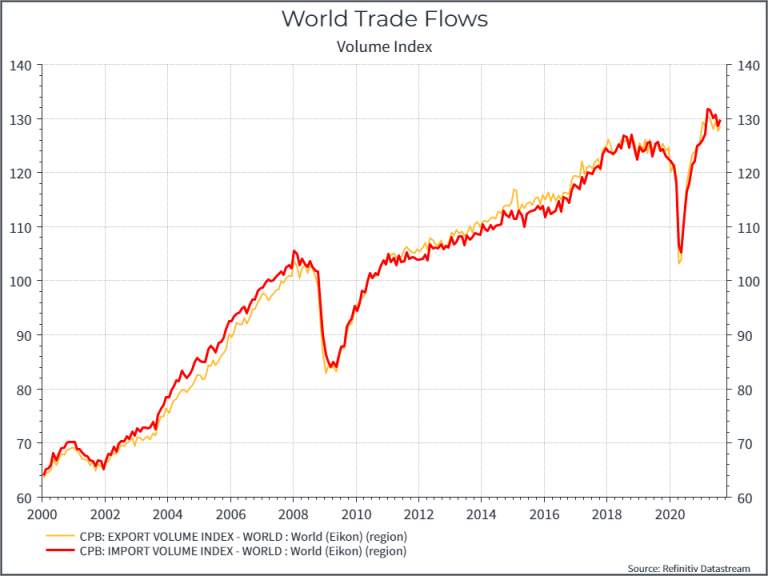
The chart below shows the evolution of global trading volumes, once again a steady rise interrupted by a couple of large declines. Current trade volumes have already returned more or less to the pre-pandemic trend level, reflecting the recovery in demand for goods around the world.
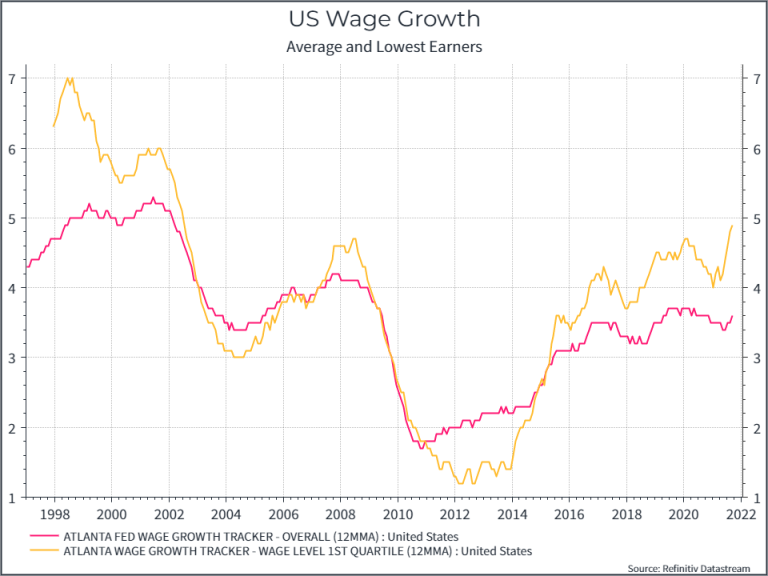
Returning to the US consumer, the graph below shows the rise in wages (for the average worker and the 10% of the lowest-wage workers). What is noticeable is steady (albeit now with higher inflation) wage growth for the average and relatively greater growth for the lowest paid.
Given the shortage of workers in the United States, particularly at the lower end of the spectrum, and the wage increases that employers like Amazon have been advocating, these trends might be expected to continue for a while.
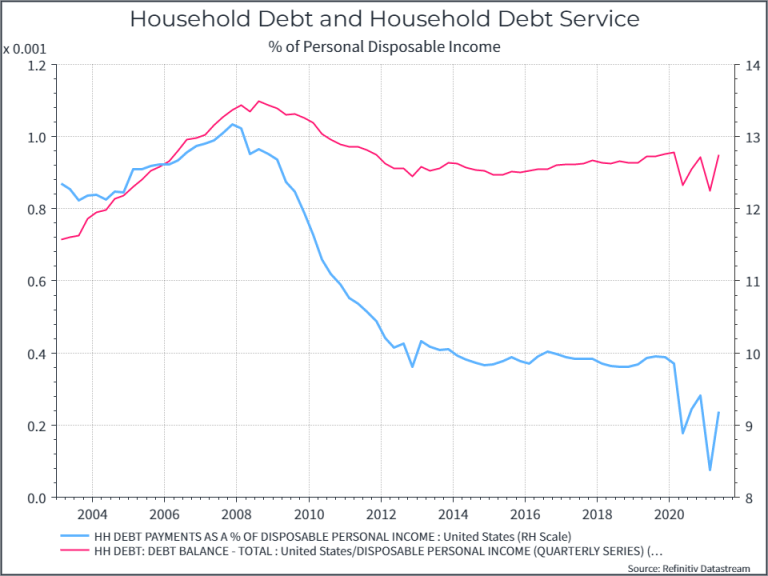
Finally, a couple of graphs on the state of American families. The first shows household debt and the cost of servicing debt relative to disposable income. Household debt did not really increase during the pandemic, while the cost of servicing the debt (interest expense) decreased, thanks to lower interest rates. There are still many struggling families in the United States, but the overall picture looks solid enough.
Similarly, the graph below shows the percentage of defaults on consumer credit cards. Again, it suggests, on the whole, that US households are managing their finances and have money to spend.
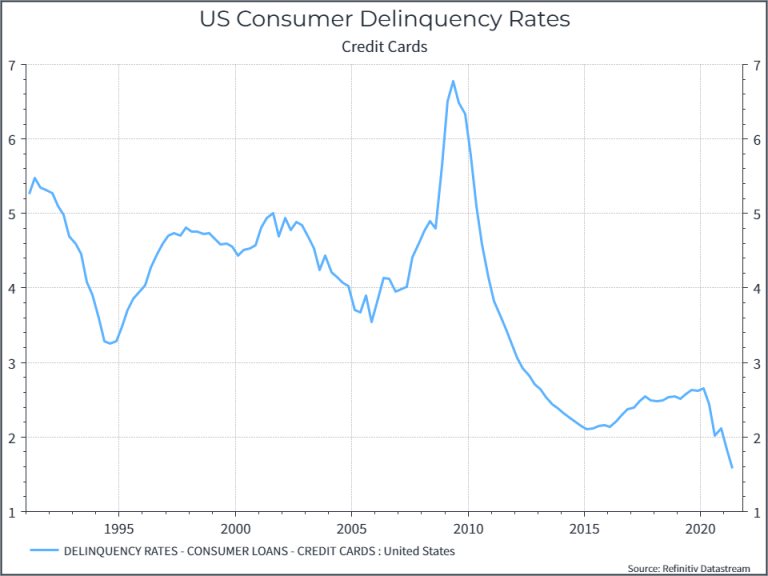
These charts tell a rather robust story of demand in the world's largest economy. And families who have the ability to continue spending, partly pushing the increase in prices. They suggest that retail sales may remain high for a long time, at least relative to the historical trend, and that a better supply chain may take a long time to adjust to demand.
This is a machine translation from Italian language of a post published on Start Magazine at the URL https://www.startmag.it/economia/vi-spiego-cause-ed-effetti-del-grande-shock-della-domanda/ on Sun, 14 Nov 2021 06:44:05 +0000.