
A bubble in three graphs, and the pin


Now, simply, we present three graphs that show how big the financial bubble is, and if you catch it, it also shows the pin that will blow it up.
First of all we present the Wilshire Index: the Wilshire 5000 Total Market Index, or more simply the Wilshire 5000, is a market capitalization weighted index of the market value of all American stocks actively traded in the United States. As of December 31, 2019, the index contained 3,473 components. The index is intended to measure the performance of most publicly traded companies based in the United States, with price data readily available (excluding Bulletin Board / penny stocks and shares of extremely small companies). Hence, the index includes most of the common stocks and REITs traded primarily through the New York Stock Exchange, NASDAQ, or the US Stock Exchange. So it is an index that measures and performs all US stocks.
What moves the index, a graph clearly shows us:
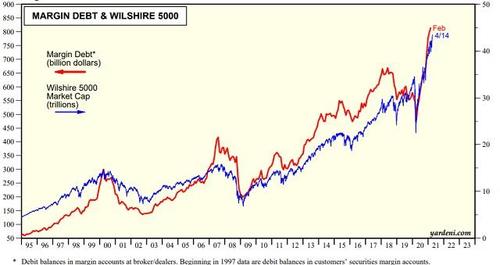
In red we have the money borrowed to “play” on the stock market in debt, towards purchases or sales, and above all, in this case, purchases. Where does this borrowed money come from? From the FED, from the liquidity introduced into the system. Where does it end: indirectly in stocks … This is also shown well by the second graph:
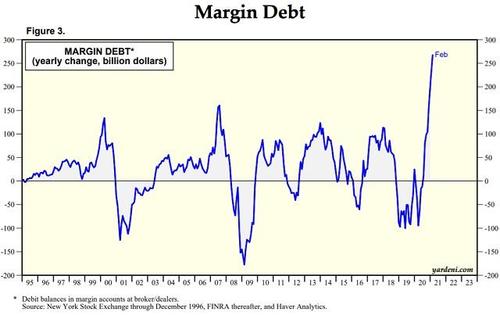
As we can see this year the marginal debt has literally exploded in spite of 2019 and 2020 rather calm. So the money to launch the stocks comes from the money supply and goes through debt. If stocks fell, who would guarantee debt service? ask yourself this question …
Now the pin:
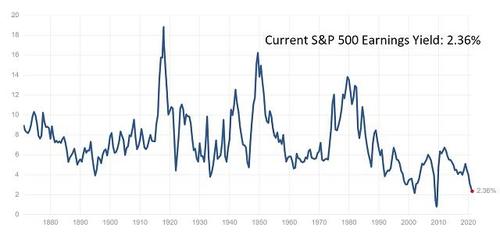
The yield on securities is falling more and more, we are now at an asphyxiated 2.36%. If the interest required by the loans that allow for purchases on margin increased, what would happen to these loans and to whoever took them out.
Ask yourself a few questions, and give yourself some answers.
![]()
Thanks to our Telegram channel you can stay updated on the publication of new articles of Economic Scenarios.
The article A Bubble in three graphics, and the pin comes from ScenariEconomici.it .
This is a machine translation of a post published on Scenari Economici at the URL https://scenarieconomici.it/una-bolla-in-tre-grafici-e-lo-spillo/ on Mon, 19 Apr 2021 07:00:07 +0000.