
The shock graph on GDP per capita, never so bad since the unification of Italy (from Canalesovranista.it)
We present this excellent article on the evolution of the Italian GDP taken from Canalesovranista.it , a blog by a very good young Italian.
In this article we will analyze a time series of Italy's GDP per capita , in real terms, spanning over 160 years. This is a very important macroeconomic indicator, which expresses the wealth produced by a nation, in final goods and services, for each citizen resident in that country.
The data are expressed in thousands of euros at constant 2015 prices , meaning that they are stripped of the effect of price changes (i.e. inflation). Therefore these data are perfectly comparable in all the years of the historical series starting from 1861, the year of the unification of Italy , and reaching 2022 (latest data available).
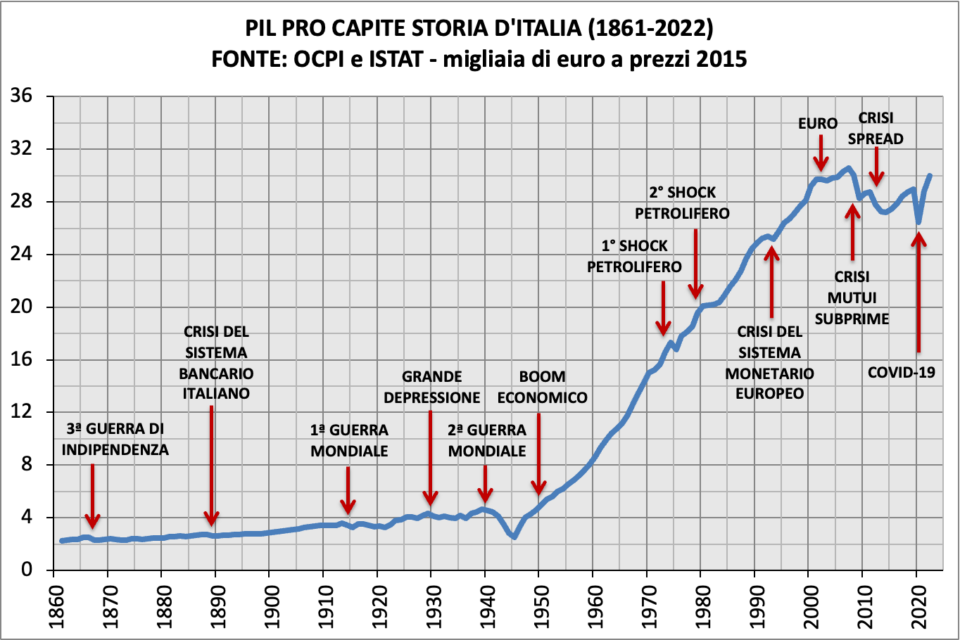
This graph tells the economic history of our country with a single line that shows, in a nutshell, how much money each resident takes home. The graph has also been enriched by the chronology of the main historical, national and international, war and economic events that have directly or indirectly affected us.
The source for the data up to 1994 is the Italian public accounts observatory (OCPI) while from 1995 to today they were taken directly from the ISTAT platform dedicated only to the data. So let's analyze the indicator by breaking down the graph into four historical periods, let's get started!
THE SECOND HALF OF THE NINETEENTH CENTURY
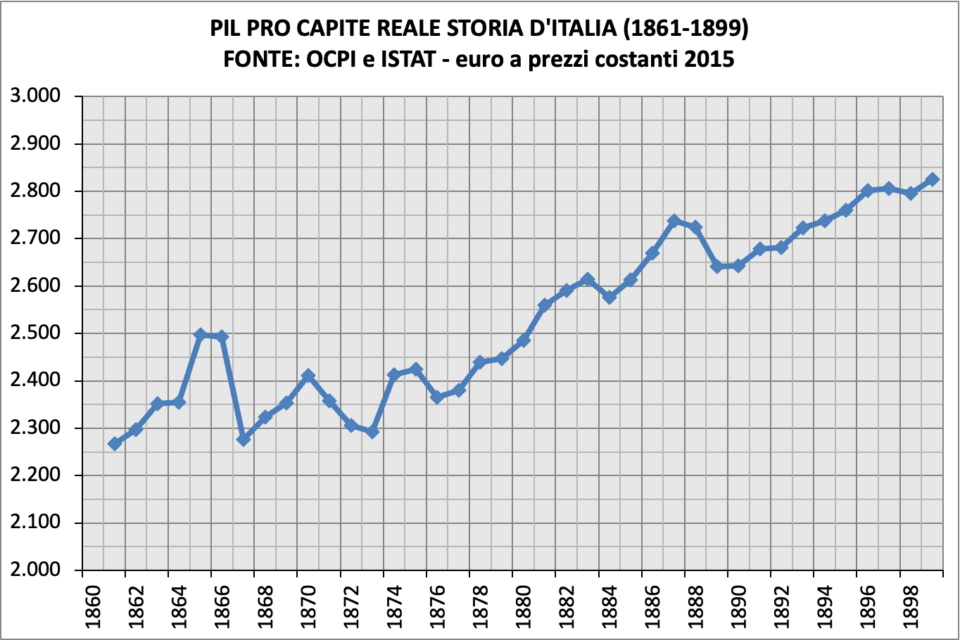
Two important recessions affected Italy during the second half of the nineteenth century, the first in 1867 as a consequence of the third war of independence , which everyone studied in history books, and the second in 1889, of a much lighter entity, which was of a financial nature although the precise causes are still being studied.
It is interesting to note how the economic consequences of the third war of independence were released in the year following the events. Here the GDP per capita fell by -8.7%, while the pre-war values of 1865 ( €2,497 ) were fully recovered in 1881 ( €2,560 ).
As regards 1889, the decrease was -3.0% with a slight contraction that had already begun in the previous year, and which was recovered in 1894 ( €2,738 the exact same value as 1887). Sifting through the Treccani encyclopedia under the heading " National Bank of the Kingdom of Italy " we read that between 1888 and 1893 the Italian banking system was hit by a serious crisis.
Taking another publication " The components of money in Italy since 1861 ", this time from the Bank of Italy, we read (on page 7) that the origins are to be found in the return of the gold peg of the Lira in 1883, whose convertibility was suspended during the aforementioned third war of independence. This re-engagement caused a euphoria that resulted in a real estate bubble – which mainly affected Rome – and with the explosion the banking system went down.
Note that the most famous episode of this crisis occurred between 1892-94 with the scandal of the Banca Romana , one of the 6 issuing institutions of the Kingdom of Italy, where however it did not correspond to any contraction in GDP (just the stagnation of the ninety two). It was resolved with the birth of the Bank of Italy as the only central bank of the Kingdom in 1893.
THE TWO WORLD WARS AND THE GREAT DEPRESSION
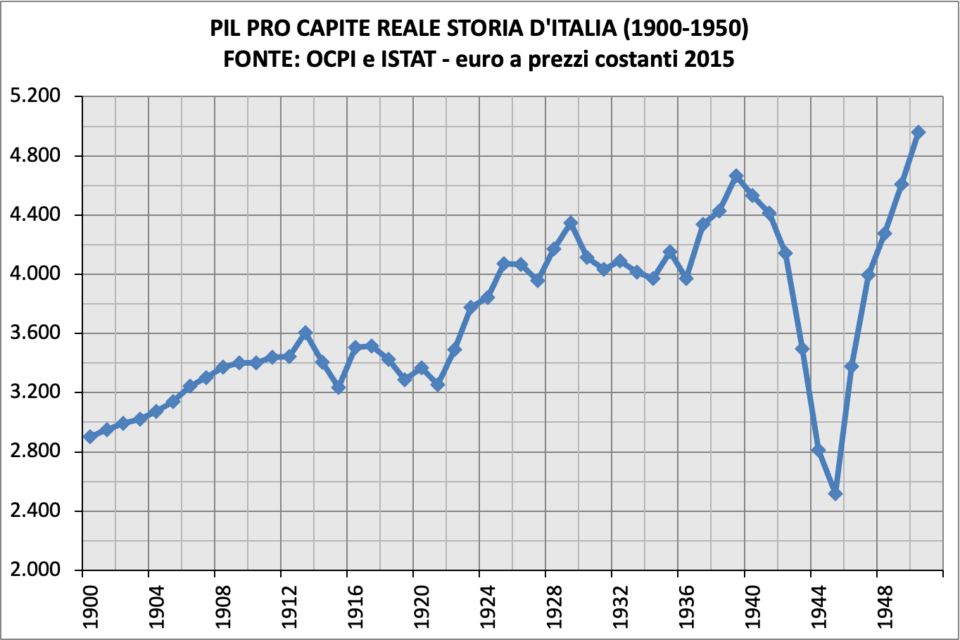
The first half of the 20th century was characterized by the tragedies of the two world wars , where in the middle there was also an economic and financial crisis of a scale never seen before: the great depression . How did Italy fare?
In 1914, with the start of the First World War, per capita income fell by -5.5% and it was not the only year of difficulty. Despite the victory on the field, difficulties continued in the post-war period with the pre-war values of 1913 ( €3,604 ) recovered only in 1923 ( €3,776 ), when in the meantime the fascist regime had been established.
Except for 1927, the year of recession for " quota 90 ", the GDP per capita grew until 1929 ( €4,345 ), when on 29 October of that year – which went down in history as "black tuesday " – the stock market collapsed of Wall Street, quickly sinking the real American economy, with rapid contagion to the rest of the world (at least the capitalist one).
In 1930 the GDP per capita decreased by -5.3%, sooner or later the countries in crisis adopted the Keynesian economic recipe to get out of it, a novelty at the time. The pre-crisis values of 1929 were recovered by Italy in 1938 ( €4,427 ), followed by another year of growth, all as a function of war preparation.
We therefore arrive at the Second World War , where Italians saw the destruction of their wealth in the space of a few years: in 1939 the GDP per capita amounted to 4,663 euros , in 1945 at the height of the war it was equal to 2,516 euros (-46%), therefore the psychological threshold of halving was very close. There was therefore a leap back to the levels of 1880-81 ( 2,485 and 2,560 euros respectively), i.e. over 60 years!
It therefore went much worse than the First World War, this is because the latter was essentially fought on our borders, while during the second conflict it was the entire country that suffered the damage of the Nazi invasion . But despite the very hard blow, in 1950 ( €4,959 ) the pre-war values of '39 were recovered.
FROM THE FIRST REPUBLIC TO THE BIRTH OF THE EU AND EURO
With the end of the Second World War, Italy became a Republic and in 1948 the Constitution came into force, while the world and Europe itself were divided into two opposing blocs , those of the two victorious superpowers (USA and USSR).
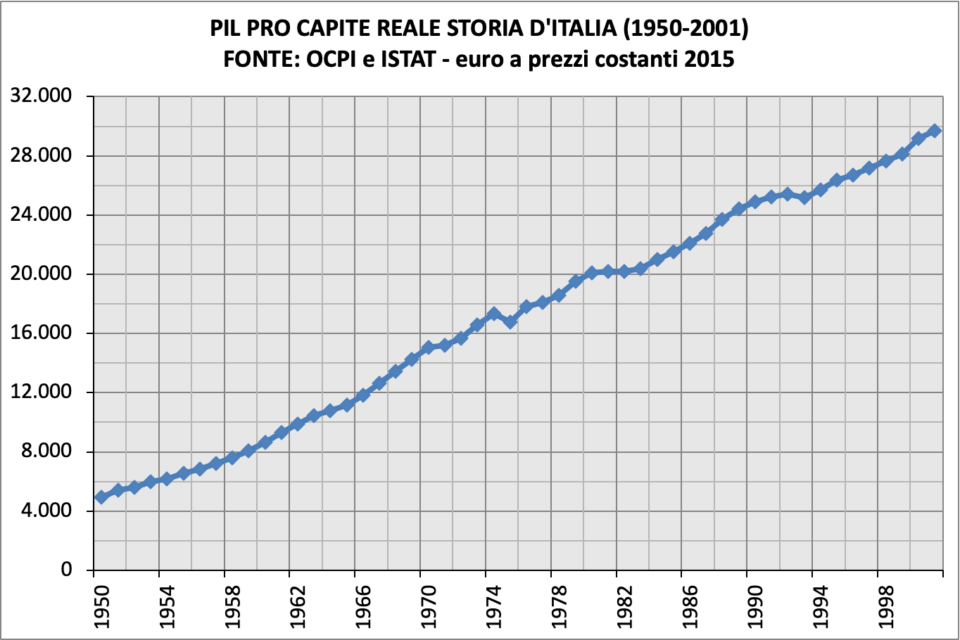
There was a country razed to the ground to be rebuilt and in the 1950s and 1960s, in a context of high generalized economic growth, the so-called economic boom , Italy stood out positively for its above-average performance. From 1950 to 1973, inclusive, each year it grew by an average of 5.5%, a result that remains unbeaten today.
But the euphoria ended in 1973 ( €16,595 ) with the first oil shock , i.e. a sharp increase in oil and energy prices, with a consequent increase in inflation. 1975 marked the first recession since the Second World War (-3.1% compared to '74), but it was brilliantly recovered the following year.
The second oil shock will arrive in 1979 ( €19,540 ), the consequence was three years of stagnation in GDP per capita from 1981 to 1983. In the second half of the 80s inflation returned to below double digits, thanks to the slowdown in oil prices , and from 1984 to 1989 average growth was a robust 3.1% per year.
We therefore arrive at the early 90s where it happened in a short time: the end of the block world, the fall of the USSR, the birth of the European Union. In 1992 ( €25,409 ), the signing of the Maastricht Treaty entailed a change in the economic model for Italy from the Keynesian one of the Constitution to the predatory mercantilist one of Federal Germany, which in the meantime had reunified.
But above all, Maastricht marked the path of convergence to reach full adoption of the single currency in 10 years, establishing its criteria and constraints. However, let us remember that the first phase of the European monetary union had already begun in 1990, with the full liberalization of capital movements.
In September 1992 the European monetary system , operational since 1979, went into crisis with the exit of the Italian lira and the British pound (the so-called " Black Wednesday "). The consequence was a generalized recession across almost the entire continent, albeit a slight one: Italy recorded -0.9% in '93 and was recovered the following year. More details about that period are described here .
THE NEW MILLENNIUM AND OUR DAYS
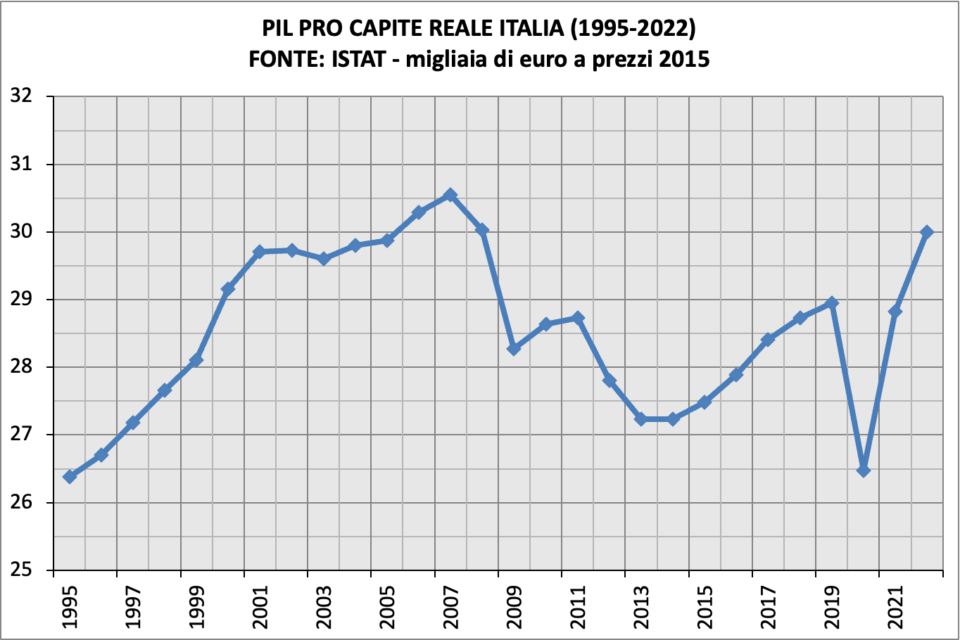
Despite the burden of the euro's convergence parameters, and the consequent "sacrifices" in the name of Maastricht, Italy continued to grow discreetly until 2001 ( €29,707 ). With the full and effective entry into force of the euro, and the consequent retirement of the Lira, Italy gets 4 years of stagnation and only the two-year period 2006-07 of growth.
In 2008, the increases in oil prices first (which reached $140 a barrel ) and the crisis imported from the USA, the one following the bankruptcy of the investment bank Lehman Brothers , already brought us into recession, but the bulk of the impact was felt in 2009 (-5.8%) in good company with most advanced economies.
This was followed by a rebound in 2010 and another in 2011 ( €28,735 ), when the word " spread " became increasingly present in the media. A new financial crisis was about to arrive, this time entirely European, the solution to which – we were told – was to make further sacrifices , which led to a further recession in the two-year period 2012-13.
From 2014 ( €27,231 ) there was a slow recovery that lasted until 2019 ( €28,944 ) which brought the GDP per capita back above the 2011 values but still very far from those of 2007 ( €30,551 ). In 2020 the pandemic hit, the record collapse of that year (-8.5%) was recovered in 2022 ( €29,996 ) and with interest (+3.6% compared to 2019). The merit? Do the exact opposite of ten years earlier, starting with the suspension of the "sacred" budget constraints .
But the prospects for 2023 are not rosy given that, again in 2022, the EU-NATO countries decide on an embargo on Russia , our (former) main energy partner, with consequent supply-driven inflation (as in the 1970s) and an increase in central bank interest rates . The “bill” will be presented this year and above all in 2024…
AN ENDLESS CRISIS: THE BUDGET
Even if in 2022 the GDP per capita recovered and exceeded the 2019 figure, it continues to remain well below the historical maximum of 2007 (-1.8%) and slightly higher than that of 2001 (+1.0 %), last year of “liretta”. We are talking about over two lost decades of the Italian economy, in peacetime however.
10 years were enough to recover the damages of the First World War, 9 were enough for those of the Great Depression, 11 were enough to rebuild the country from the Second World War. The two recessions of 1975 and 1993 just tickled the beautiful country.
And what has changed from 2000 to today? Why does the curve that has grown continuously since the Second World War suddenly bend, bend and then collapse following the introduction of the euro ? Is it legitimate to establish a cause-effect link when the data tells us about an unprecedented disaster, with a clear temporal sequence between the two events?
There remains only one negative record to beat, that of the third war of independence, which is never far away. In fact, if the 2023 figure , which is very likely, continues to be lower than that of 2007, it will officially be the longest crisis in the history of Italy.
While for the young Kingdom of Italy 16 long years were still enough to bring the GDP per capita back to the pre-war levels of 1865, today not despite being "light years" more advanced than then. The final verdict in March 2024!
![]()
Thanks to our Telegram channel you can stay updated on the publication of new Economic Scenarios articles.
The article The shock graph on GDP per capita, never so bad since the unification of Italy (from Canalesovranista.it) comes from Economic Scenarios .
This is a machine translation of a post published on Scenari Economici at the URL https://scenarieconomici.it/il-grafico-shock-sul-pil-pro-capite-mai-cosi-male-dallunita-ditalia-da-canalesovranista-it/ on Mon, 02 Oct 2023 06:00:12 +0000.